
Transplant Quality Measures
The Transplant Center at Cedars-Sinai strives to deliver the highest quality of care to all patients. As part of this commitment, we are dedicated to providing transparency for our patient outcome rates across a number of procedures.
The information below provides an in-depth look at the data for key procedures performed by Cedars-Sinai, as well as their outcome rates, including mortality and length of hospital stay. These reports aim to reduce ambiguity in procedure outcome data, so that patients and their loved ones can make decisions with the utmost confidence regarding their medical care.
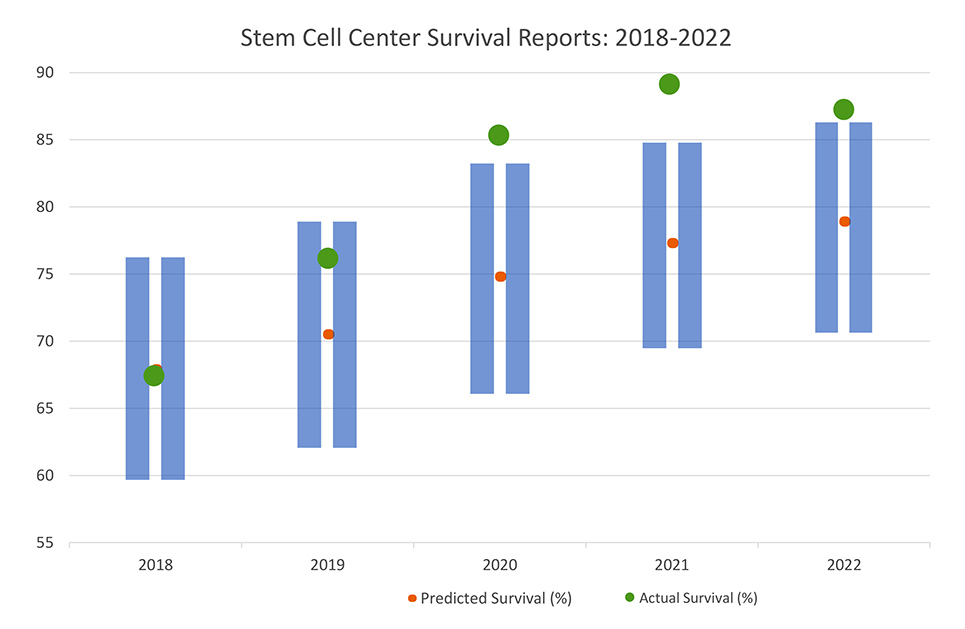
Cedars-Sinai Blood and Marrow Transplant program ranks in the Top 10 in the U.S. for patient survival.1
The program’s one-year allogeneic transplant survival results are higher than the expected rate, with superior outcomes.1
1 Center for International Blood and Marrow Transplant Research. (2021). Final 2021 Transplant Center-Specific Survival Report (pp. 1–66) [Review of Final 2021 Transplant Center-Specific Survival Report].
A successful heart transplant depends on:
- Appropriate evaluation of the heart recipient
- Expertise in the surgical procedures required to transplant the heart
- Ongoing monitoring after transplant to prevent heart rejection or infections
At Cedars-Sinai, we report our data to the United Network for Organ Sharing, a regulatory organization for organ transplants. Information for hospitals in the United States performing transplants is shared with the Scientific Registry of Transplant Recipients, which compares and publishes information about patient characteristics, waiting lists and outcomes by hospital.
The Cedars-Sinai 1-year patient and graft survival data is presented below, compared to the national estimated survival rate, the rate that would be expected given the characteristic mix of the recipient and donor (age, disease, blood type, etc.), and the experience of similar patients in the U.S.
These statistics reflect adults 18 and older who were having their first heart transplant. Patients who were having other organ transplants along with a heart transplant are not included.

A successful lung transplant depends on:
- Properly evaluating the person receiving the donated lung
- Properly matching the lung donor to the person receiving the lung to assure compatibility between them
- Expertise in the surgical procedures needed to remove the failing lung and replace it with a donated lung
- Expertise in transplant medicine to ensure the health of the transplanted lung and manage any potential complications such as rejection or infections
At Cedars-Sinai, we report our data to the United Network for Organ Sharing, a regulatory organization for organ transplants. Information for hospitals in the United States performing transplants is shared with the Scientific Registry of Transplant Recipients, which compares and publishes information about patient characteristics, waiting lists and outcomes by hospital.
The Cedars-Sinai 1-year patient and graft survival for transplants is presented below, compared to the national estimated survival rate, the rate which would be expected given the characteristic mix of the recipient and donor (age, disease, blood type, etc.), and the experience of similar patients in the U.S.
These statistics reflect adult patients age 18 and older who had their first lung transplant. Patients who were having other organs transplanted at the same time (multiple organ transplantation) are not included.
Our results at Cedars-Sinai are not statistically significantly different than expected and reflect the high-risk patients that we have elected to transplant. We are committed to excellence in the care we provide to our patients and are willing to consider lung transplantation in patients that other centers consider to be too high-risk for this procedure.

A successful liver transplant depends on:
- Appropriate evaluation of the organ recipient
- Expertise in the surgical procedures required to transplant the organ
- Ongoing monitoring after transplant to prevent organ rejection or infections
At Cedars-Sinai, we report our liver transplant data to the United Network for Organ Sharing, a regulatory organization for organ transplants. Information for hospitals in the United States performing transplants is shared with the Scientific Registry of Transplant Recipients, which compares and publishes information about patient characteristics, waiting lists and outcomes by hospital.
The Cedars-Sinai 1-year patient and graft survival data for liver transplants is presented below, compared to the national estimated survival rate, the rate that would be expected given the characteristic mix of the recipient and donor (age, disease and blood type, etc.), and the experience of similar patients in the U.S.
These statistics reflect adult patients age 18 and older who had their first liver transplant. Patients who were having other organs transplanted at the same time (multiple organ transplantation) are not included.

A successful kidney transplant depends on:
- Appropriate evaluation of the kidney recipient
- Expertise in the surgical procedures required to transplant the kidney
- Ongoing monitoring after transplant to prevent kidney rejection or infections
At Cedars-Sinai, we report our data to the United Network for Organ Sharing, a regulatory organization for organ transplants. Information for hospitals in the United States performing transplants is shared with the Scientific Registry of Transplant Recipients, which compares and publishes information about patient characteristics, waiting lists and outcomes by hospital.
The Cedars-Sinai patient and graft survival data for adult and pediatric transplant patients is presented below by donor type (deceased vs. living) and compared to the national estimated survival rate, the rate which would be expected given the characteristic mix of the recipient and donor (age, disease and blood type, etc.), and the experience of similar patients in the U.S.
Patient and Graft Survival Rates for Adult Kidney Transplant Patients
These statistics reflect patients age 18 and older who were having their first kidney transplant. Patients who were having other organ transplants along with a kidney transplant are not included. The data has not been risk adjusted for highly sensitized patients.


Patient and Graft Survival Rates for Pediatric Kidney Transplant Patients
These statistics reflect patients under the age of 18 when they received their first kidney transplant. Patients who were having other organ transplants along with a kidney transplant are not included. The data has not been risk adjusted for highly sensitized patients.


A successful pancreas transplant depends on:
- Appropriate evaluation of the recipient
- Expertise in the surgical procedures required to transplant the organs
- Ongoing monitoring after transplant to prevent organ rejection or infections
At Cedars-Sinai, we report our data to the United Network for Organ Sharing, a regulatory organization for organ transplants. Information for hospitals in the United States performing transplants is shared with the Scientific Registry of Transplant Recipients, which compares and publishes information about patient characteristics, waiting lists and outcomes by hospital.
The Cedars-Sinai 1-year patient survival for pancreas transplant is presented below, compared to the national estimated survival rate, the rate which would be expected given the characteristic mix of the recipient and donor (age, disease and blood type, etc.), and the experience of similar patients in the U.S.
These statistics reflect adults age 18+ who were having their first pancreas transplant. Patients who were having other organ transplants along with a pancreas transplant are not included.

A successful pancreas-kidney transplant depends on:
- Appropriate evaluation of the recipient
- Expertise in the surgical procedures required to transplant the organs
- Ongoing monitoring after transplant to prevent organ rejection or infections
At Cedars-Sinai, we report our data to the United Network for Organ Sharing, a regulatory organization for organ transplants. Information for hospitals in the United States performing transplants is shared with the Scientific Registry of Transplant Recipients, which compares and publishes information about patient characteristics, waiting lists and outcomes by hospital.
The Cedars-Sinai 1-year patient and graft survival data for kidney-pancreas transplant is presented below, compared to the national estimated survival rate, the rate which would be expected given the characteristic mix of the recipient and donor (age, disease and blood type, etc.), and the experience of similar patients in the U.S.
For the most current period reported, Cedars-Sinai performed more simultaneous pancreas-kidney transplants than any other hospital in Southern California. These statistics reflect adults age 18 and older who were having their first pancreas-kidney transplant. Patients who were having other organ transplants along with a pancreas-kidney transplant are not included.

Have Questions or Need Help?
If you have questions or wish to learn more about quality measures at Cedars-Sinai, please send us a message.