
Translational Cardiac Imaging Research
Mission
The mission of the Translational Cardiac Imaging Research program led by Rohan Dharmakumar, PhD, is to develop diagnostic and therapeutic strategies in the fight against cardiovascular diseases, using a multifaceted, interdisciplinary approach. Through developing new or using existing noninvasive, cutting-edge imaging methods, the program strives to create synergies in basic science research and build a rigorous scientific basis for rapid translation of preclinical findings to clinical patient care.
Focus
Ischemic heart disease, a class of diseases that stems from reduced oxygen supply to the heart muscle, is the most common cause of death in Western countries. The focus of the program is to better understand pathophysiology of ischemic heart disease with MRI and PET. Our current investigations center on:
- Coronary physiology and blood flow in ischemic heart disease
- Development of non-contrast-enhanced cardiac MRI methods for perfusion and viability
- Theranostics for chronic heart failure
- Definition of imaging biomarkers in post-infarction sudden cardiac arrest/death
Explorations into Novel Ways of Vasodilating the Heart
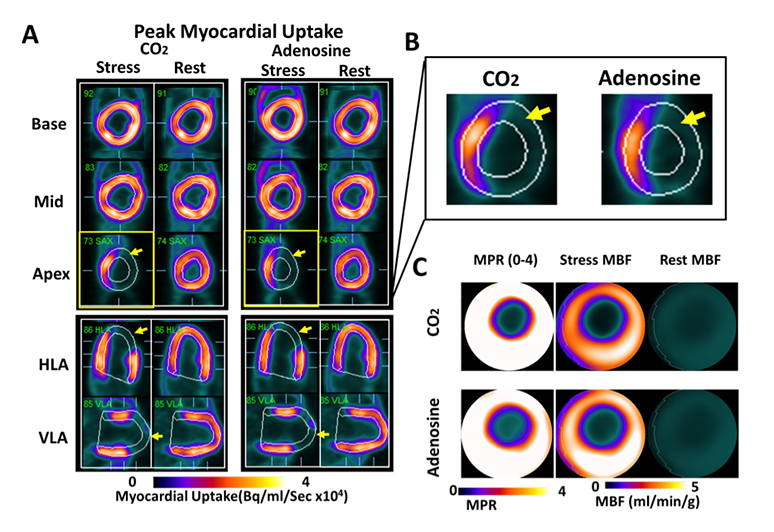
Regional Myocardial Blood Flow Response to Hypercapnia and Adenosine in the Presence of Coronary Stenosis are the Same. Panel A shows representative short- (base, mid, apex) and long-axis (HLA and VLA) PET images of peak myocardial uptake of 13N-ammonia during hypercapnia of PaCO2 ~ 60 mmHg (CO2), standard clinical dose of adenosine (Adenosine), and at rest with PaCO2 ~ 35 mmHg (rest), in a canine with a coronary stenosis of the LAD. Note the differentially lower uptake of the radiotracer in the anterior lateral wall (as evidenced by the lower signal in myocardial segments supplied by the distal LAD; yellow arrows) under hypercapnia and adenosine. For ease of visualization, reduced tracer uptake in the LAD territory during peak uptake in remote regions (i.e., those not impaired by coronary stenosis) is highlighted in the zoomed-in apical short-axis image under hypercapnia and adenosine in Panel B. For the case in Panel A, rest and stress MBF (under hypercapnia and adenosine) and corresponding MPR are shown as polar maps in Panel C. These images show a marked preferential reduction in MBF and MPR in the supply regions of the LAD, which are visually evident and spatially consistent under hypercapnia and adenosine.
New Insights into Pathophysiology of Myocardial Infarction
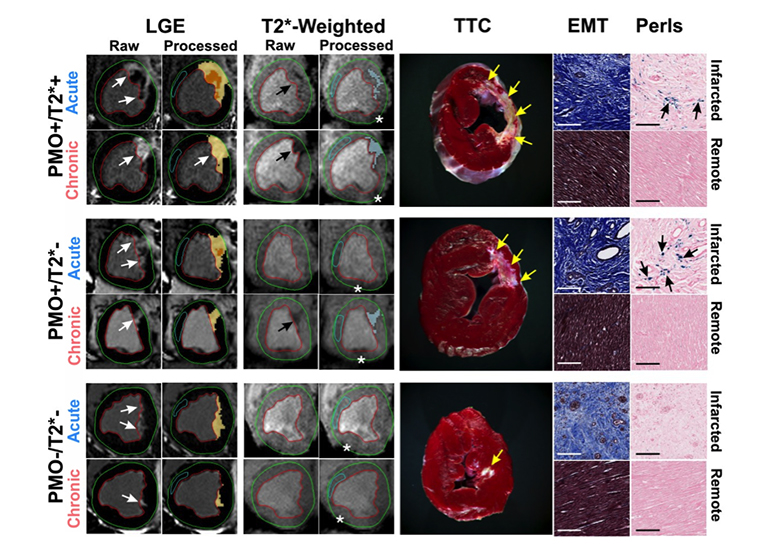
Persistent Microvascular Obstruction in Reperfused Myocardial Infarction Leads to Chronic Iron. Representative in-vivo raw and processed LGE and T2*-weighted images from reperfused canines acquired in both acute and chronic phases post-MI are shown. Arrows point to the sites of MI and iron deposition on LGE and T2*-weighted images, respectively. Corresponding ex-vivo histological sections stained with TTC, EMT and Perls stain are also shown. Scale bars in the microscopic histology images correspond to 50μm. Note the significant chronic iron deposition in the PMO+/T2*– group, despite the absence of acute reperfusion hemorrhage. Perls stain confirmed the presence of chronic iron deposition (blue deposits pointed at by the arrows) in the PMO+/T2*+ and PMO+/T2*– groups, but not in the PMO–/T2*– group. EMT stains showed significant fibrosis in the infarcted territory compared to a very mild diffuse fibrosis in the remote territory, which were not visually evident on LGE. Asterisks in the T2*-weighted images point to the sites of off-resonance artifacts that were manually excluded in the final analysis.
Iron Deposits as a Novel Marker for Ventricular Arrhythmia
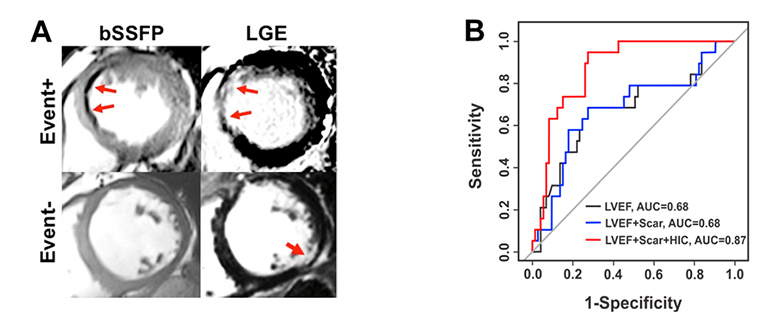
Iron Deposits with Chronic Infarction Territories as a Novel Marker of Arrhythmia Risk. Presence of hypointense core (HIC) within representative chronic infarction territories on bSSFP images (A) and (B) their predictive value for the primary endpoint (occurrence of appropriate ICD therapy, survived cardiac arrest or sudden cardiac death) A: Representative bSSFP and LGE CMR images from two patients receiving ICD therapy; one who met the primary endpoint (Event+) and one who did not meet the primary endpoint (Event-). For the Event+ patient, blue arrows denote the MI region on Late Gadolinium Enhancement (LGE) imaging and the Hypo-Intense Core (HIC) region on bSSFP imaging. In the Event- patient, no HIC were observed by bSSFP within the MI region, indicated by the red arrow on LGE imaging. B: Corresponding ROC curves for LVEF, LVEF+Scar Volume and LVEF+Scar Volume+HIC for the prediction of the primary endpoint. While the addition of Total Scar Volume alone did not improve the predictive accuracy over LVEF, the addition of HIC improved the AUC from 0.69 to 0.87, suggesting additional prognostic value of HIC. http://circimaging.ahajournals.org/content/8/8/e003642.
Technical Cardiac MRI Developments for Non-Contrast Assessment of Myocardial Perfusion
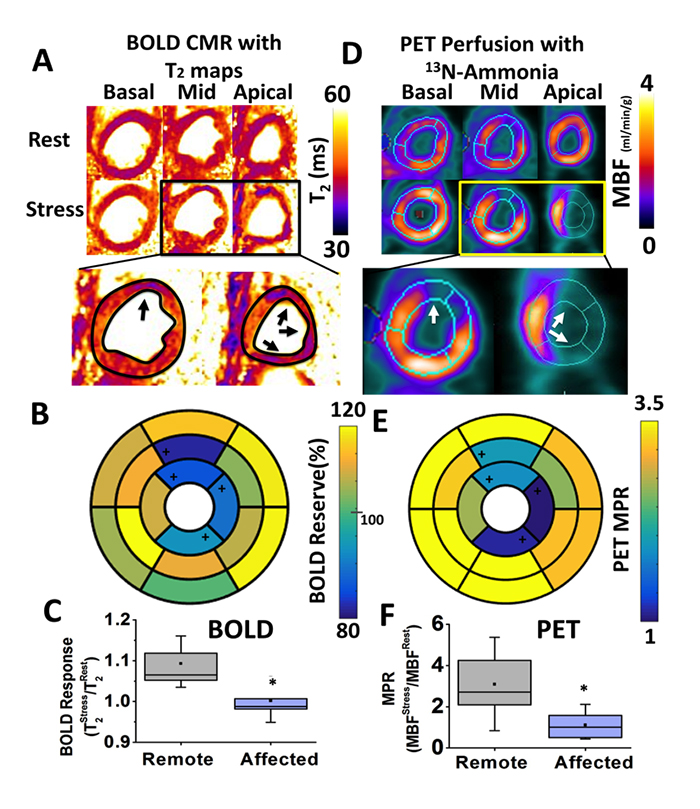
Fast (<5 minutes), Heart-Rate-Independent, Whole-Heart, Free-Breathing, Three-Dimensional Myocardial BOLD MRI at 3T and 13N-ammonia PET at Rest and Under Adenosine Stress in Canines with LAD Coronary Stenosis. Panel A shows representative basal, mid and apical short-axis T2 maps at rest and under stress, from a canine with LAD coronary stenosis. Panel D shows the corresponding quantitative myocardial blood flow (MBF) maps determined from 13N-ammonia PET. Note the close correspondence in the MBF distribution and T2 maps, particularly under adenosine stress. Specifically, the remote territories on PET images showed increased T2 values on T2 maps acquired under adenosine. Conversely, the affected territories on PET images (anterior wall corresponding to LAD territory; white arrows in zoomed-in images) showed markedly diminished increase in T2 (black arrows in zoomed-in images) compared to remote segments. Corresponding polar maps for BOLD and PET are shown in Panels B and E, respectively. Affected segments identified with change analysis from QPET are labeled with ‘+’ in the polar maps. Both BOLD Response and PET MPR showed significantly lower values in the affected territories compared to the remote segments (Panels C and F, respectively).
Development of Non-Contrast Cardiac MRI Methods for Detection and Characterization of Chronic Myocardial Infarction
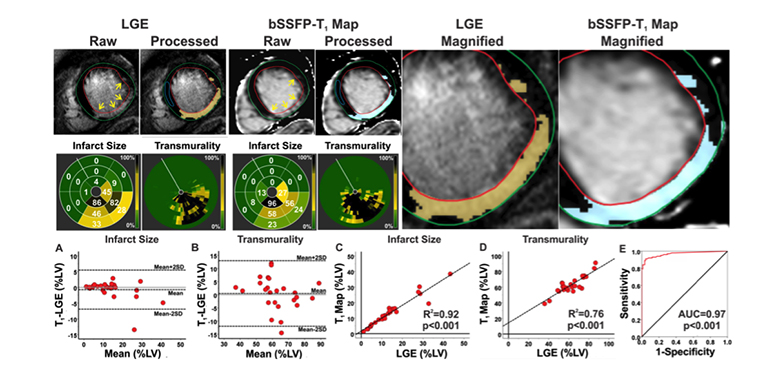
Characterizing Chronic MI in Patients. Typical short-axis LGE images and non-contrast bSSFP-T1 maps from a STEMI patient with chronic MI at 3T are shown. MI (highlighted dark-blue pixels in the processed images) was identified on both LGE images and bSSFP-T1 maps. Bulls-eye plots depicting the size and transmurality of the MI are shown for both LGE and T1. Similar to canines, excellent correlations were observed between LGE images and bSSFP-T1 maps in terms of the location, spatial extent and transmurality of the infarcted myocardium. bSSFP-T1 maps and LGE images were not different for measuring infarct size (p=0.90) and transmurality (p=0.52). Bland-Altman analysis showed excellent agreement between LGE and bSSFP-T1 maps for measuring infarct size (A) and transmurality (B). Excellent correlations were observed between LGE images and b-SSFP T1 maps for infarct size (R2=0.92; C) and transmurality (R2=0.76; D). ROC analysis showed that the area under the curve was 0.96 (E). doi:10.1016/j.jcmg.2015.04.018.
Collaborative Research
The Translational Cardiac Imaging Research program led by Rohan Dharmakumar, PhD, in the Dharmakumar Laboratory has an active collaborative research program with local, national and international collaborators. Key collaborators include:
Internal Collaborators
External Collaborators
- Louis Bouchard, PhD, UCLA, Los Angeles, California
- Alice Dohnalkova, MS, Pacific Northwest National Laboratory, Richland, Washington
- Joseph Fisher, MD, University of Toronto, Ontario, Canada
- Joseph Francis, PhD, Louisiana State University, Baton Rouge, Louisiana
- Nikolaos Frangogiannis, MD, Albert Einstein Medical School, New York, New York
- Hyuk-Jae Chang, MD, Yonsei University, Seoul, South Korea
- Warren Jackman, MD, Oklahoma Health Sciences Center, Oklahoma City, Oklahoma
- Andreas Kumar, MD, Health Sciences North, Ontario, Canada
- Frank Prato, PhD, University of Western Ontario, Canada
- Sotirios Tsaftaris, PhD, University of Edinburgh
- James White, MD, University of Calgary, Alberta, Canada
- John Wood, MD, PhD, Children’s Hospital, Los Angeles, California
Have Questions or Need Help?
If you have questions or would like to learn more about the Biomedical Imaging Research Institute at Cedars-Sinai, please call or send us a message.
Biomedical Imaging Research Institute
Pacific Theatres Building, Suite 400
116 N. Robertson Blvd.
Los Angeles, CA 90048